

YUNOVA Stories · Data & AI
Hans Rosling: the doctor who made data tell the truth
Hans Rosling · Swedish doctor, professor of global health and co-founder of Gapminder
Written by YUNOVA from public sources. Hans Rosling is not affiliated with and does not endorse YUNOVA.यह कहानी YUNOVA ने public sources से लिखी है। इसमें बताए गए व्यक्ति YUNOVA से जुड़े नहीं हैं और YUNOVA का समर्थन नहीं करते।
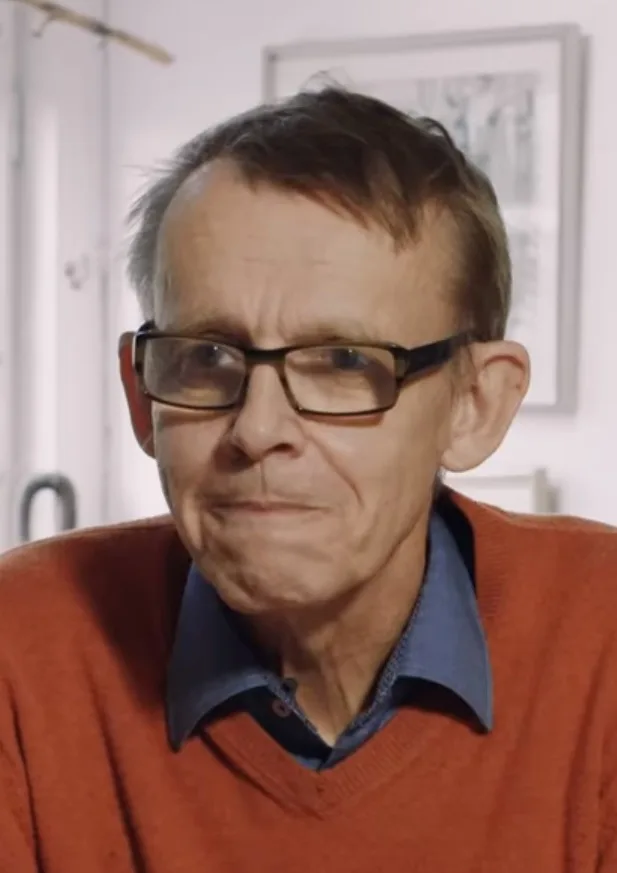
Hans Rosling was a Swedish doctor who became one of the world's best-loved teachers of data. He used moving charts, toy bricks and even teacups to show how health, wealth and population were really changing across countries. He never claimed numbers were magic. He claimed they were the only honest starting point for a good argument. His story shows that data analysis is not about software. It is about seeing clearly and explaining clearly.
A doctor who saw poverty up close
Rosling studied statistics and medicine at Uppsala University in Sweden, and also studied public health at St. John's Medical College in Bangalore, India. He became a licensed doctor in 1976. That unusual pairing, numbers and medicine, ran through everything he did later.
With his wife Agneta he went to work in Mozambique, where the family was posted to Nacala in the north. A colleague from Karolinska Institutet later wrote that the work took all his energy, and that Rosling had told him the brutality of extreme poverty only truly struck him there. That experience, the colleague wrote, turned him into a teacher who wanted everyone to understand it.
“Fame is easy to acquire, impact is much more difficult.”
— Hans Rosling, via The Guardian
From professor to edutainer
From 1997 Rosling was a professor at Karolinska Institutet in Stockholm, teaching global health. Colleagues remember a short quiz he liked to use, a handful of questions on things like child mortality in different countries. His point was that many people's picture of the world is out of date. In a 2013 interview he noted that Swedes, asked how many children are born per woman in Bangladesh, still guessed four to five.
His first TED talk in 2006 made him famous around the world. He showed animated charts in which each country was a bubble, moving year by year as its income and health changed. The Guardian later described these animated visualisations as his signature, along with his habit of using children's toys, cardboard boxes and teacups to make figures easy to grasp. He liked to call himself an edutainer.
Together with his son Ola Rosling and daughter-in-law Anna Rosling Rönnlund he founded Gapminder, a foundation that builds free tools for a fact-based view of the world. In 2007 he cut his university role to a small fraction so that most of his time could go to Gapminder. He presented BBC documentaries, including The Joy of Stats, and in 2014 he went to Liberia during the Ebola outbreak to help the government track cases and find missing data.
Factfulness and a lasting legacy
Time magazine included him in its 2012 list of the world's 100 most influential people. Rosling died on 7 February 2017 in Uppsala, aged 68, after a year-long illness. Later that year he was given the United Nations Population Award.
His last book, Factfulness, written with Ola and Anna, came out in 2018. It describes ten instincts that distort how we see the world, such as dividing everything into two camps or believing that most things are getting worse. Gapminder continues his work.
Other honours came before that. Foreign Policy listed him among 100 leading global thinkers, Fast Company named him one of the 100 most creative people in business, and the Swedish Medical Society gave him its Jubilee Prize. According to the United Nations Population Fund, he regularly gave presentations for free to raise awareness of global health issues.
The skills and habits that made the difference
The first was combining fields. He knew medicine and he knew statistics, so he could ask the right health questions and read the numbers behind them. Good analysts understand the subject, not only the spreadsheet.
The second was clear presentation. A table of figures for two hundred countries is hard to read; a bubble that moves across a chart is not. He chose the simplest picture that told the truth, and he practised telling the story behind it.
The third was honesty about evidence. A former colleague wrote that he would change his mind when proven wrong, as he did when large-scale HIV treatment in Africa turned out to work. He wanted people to look at all the facts, good and bad, before they argued about what to do.
The fourth was sheer effort. A fellow professor remembered driving with him every day from Uppsala to Karolinska Institutet, arriving at dawn, and once still copying factsheets for coming lectures near midnight. When colleagues suggested he rest, he would joke that he could rest after he died. Clear explanations took hours of preparation behind the scenes.
What you can learn from Hans Roslingइस कहानी से आप क्या सीख सकते हैं
- Know the question before the chartRosling's charts worked because he understood health and poverty. Before you analyse a dataset, learn enough about the topic to know which questions matter.
- Pick the simplest true pictureOne clear chart beats ten confusing ones. Try showing your result with a single visual, and ask a friend what they understand from it.
- Test what people already believeHis quizzes showed how wrong common beliefs can be. When you find a surprising number, check it twice, then explain why it surprises.
- Be ready to change your mindData is useful only if you let it correct you. When new evidence disagrees with your view, update the analysis instead of hiding the result.
How you can build this skill on YUNOVAYUNOVA पर आप यह skill कैसे सीख सकते हैं
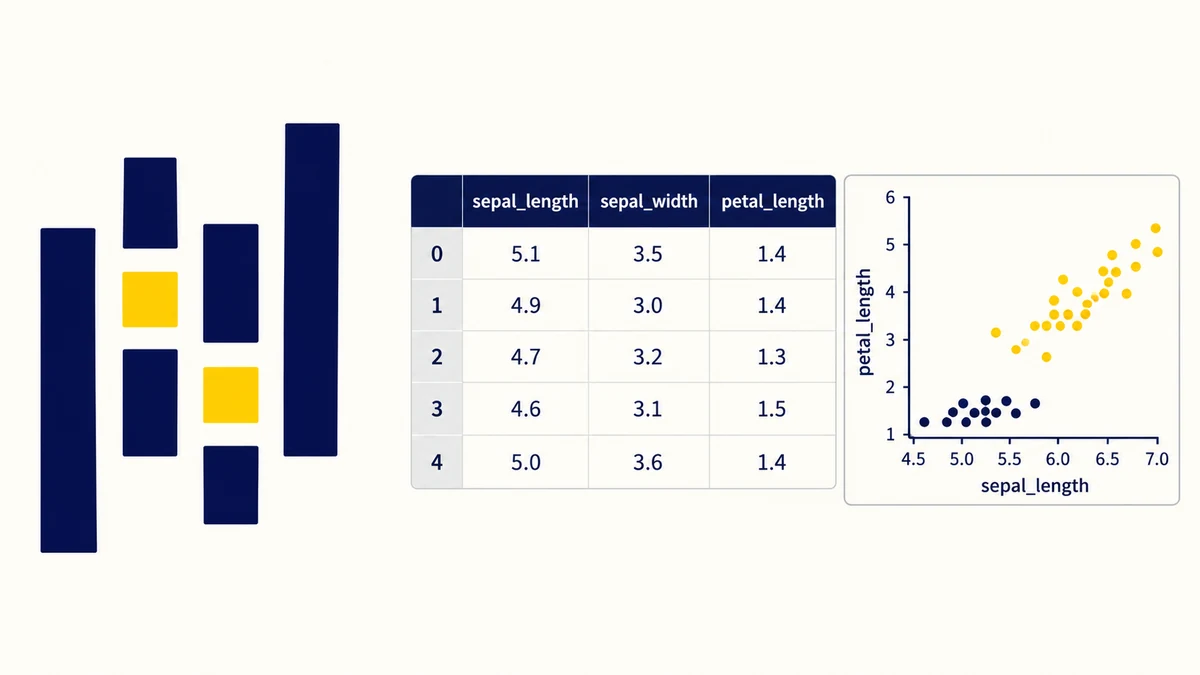
Nobody becomes Hans Rosling from one course. But the habits he showed, asking good questions, cleaning and comparing numbers, and presenting them so anyone can understand, are skills you can build one step at a time. On YUNOVA you can learn Data Analysis step by step, for free, in Hindi.
हिंदी में सारांश
हैंस रोसलिंग स्वीडन के एक डॉक्टर थे जिन्होंने statistics और medicine दोनों पढ़े। मोज़ाम्बिक में काम करते हुए उन्होंने गरीबी को करीब से देखा और बाद में चलते हुए bubble charts से दुनिया को data समझाया। उनकी 2006 की TED talk और किताब Factfulness ने लाखों लोगों को तथ्यों से दुनिया देखना सिखाया। आप भी YUNOVA पर Data Analysis की skill हिंदी में मुफ़्त सीखना शुरू कर सकते हैं।
Sourcesस्रोत
- Hans Rosling, statistician and development champion, dies aged 68, The Guardian (accessed 18 October 2026)
- Memories of Hans Rosling, Karolinska Institutet (accessed 18 October 2026)
- Sweden's Hans Rosling, Niger NGO Win 2017 UN Population Award, United Nations Population Fund (accessed 18 October 2026)
- Factfulness, Macmillan (accessed 18 October 2026)
- Hans Rosling, Wikipedia (accessed 18 October 2026)
Written by YUNOVA from public sources. Hans Rosling is not affiliated with and does not endorse YUNOVA.
More storiesऔर कहानियाँ
- Amartya Sen: from Santiniketan to the Nobel, economics for human welfareEconomist and philosopher, 1998 Nobel laureate in economic sciences
- Andrew Ng: the professor who put machine learning online for everyoneCo-founder of Coursera and founding lead of Google Brain
- Andy Jassy: the marketing manager who built Amazon Web ServicesFounding leader of Amazon Web Services and Amazon's CEO